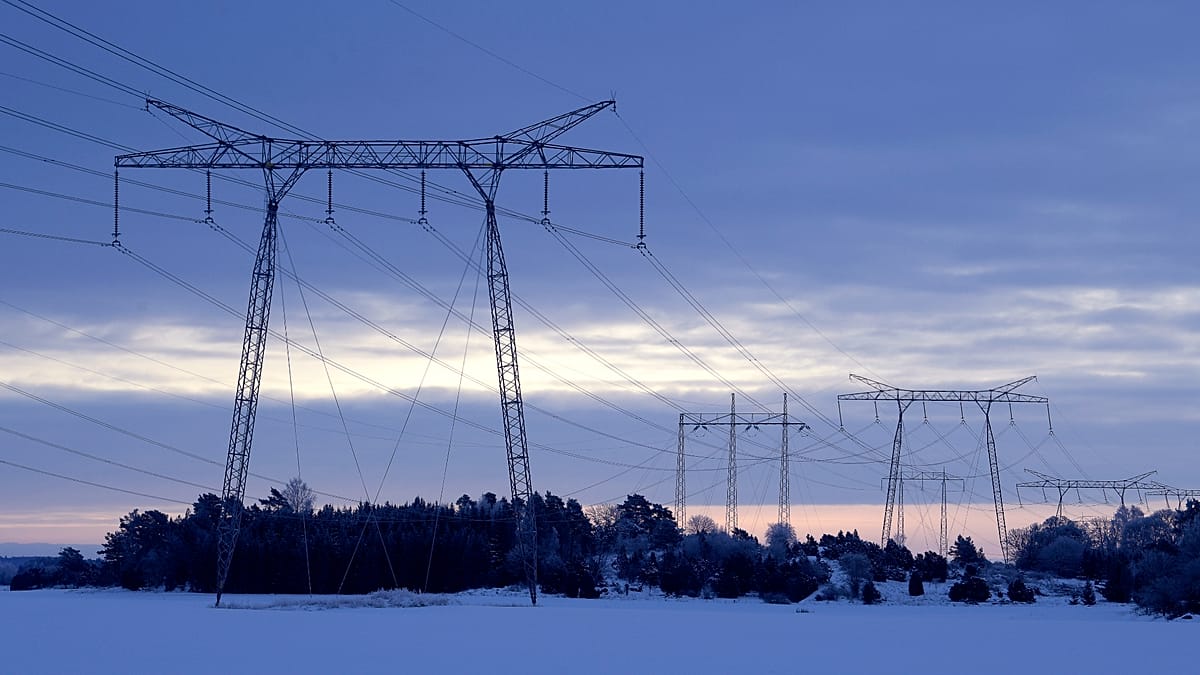
As winter approaches, European households are bracing for higher energy bills. Wholesale gas prices have surged to levels not seen in nearly four years, with the Dutch TTF benchmark reaching €87.20 per megawatt-hour on Tuesday, up from about €32 before the Iran war. The conflict in the Middle East has disrupted shipping through the Strait of Hormuz, a vital route for about a fifth of the world's liquefied natural gas.
While petrol and diesel prices have already hit records across the EU, household gas and electricity prices have risen more slowly. According to the EU Weekly Oil Bulletin, average consumer diesel prices rose by 35% between 23 February and 5 October 2026, while petrol increased by 23%. In contrast, residential gas prices including taxes rose by 12% on average across EU capital cities between 2 February and 1 September 2026, and electricity by 4.2%, based on the Household Energy Price Index (HEPI) compiled by Energie-Control Austria, MEKH and VaasaETT.
Fixed contracts and government support can delay or soften the impact of higher wholesale prices on household bills. Higher gas prices also push up electricity costs by making gas-fired power generation more expensive. To understand the real burden, we compare prices per unit of energy—not total bills, which depend on consumption—across European capitals, both in euro terms and adjusted for purchasing power.
Electricity: Brussels tops the list, Kyiv the cheapest
As of early September 2026, residential electricity prices including taxes ranged from 8.4 euro cents per kilowatt-hour (c€/kWh) in Kyiv to 41.3 c€/kWh in Brussels. The EU average across capital cities was 27.2 c€/kWh. Berlin (39.6), Dublin (38.7), Bern (38.6) and London (38.3) completed the top five most expensive cities, followed by Rome (36.6), Vienna (34.4) and Prague (34.3).
At the cheaper end, Budapest (10.3), Podgorica (11.3), Belgrade (11.6) and Valletta (12.3) followed Kyiv. While the capitals of Germany, the UK and Italy ranked among the most expensive, Madrid (28.3) and Paris (28.1) were lower, though both remained above the EU average.
When adjusted for purchasing power standards (PPS), which account for differences in the cost of living, the rankings shift substantially. Bucharest becomes the most expensive city at 55.1, while Oslo ranks as the cheapest at 11.5. Among the capitals of Europe's five largest economies, Rome (38.2) is the most expensive in PPS terms, while Paris (25.8) is the cheapest. Berlin (35.5), Madrid (31.6) and London (30.9) all sit above the EU average of 29.6. Bucharest and Warsaw record the largest upward shifts, each rising 10 places, while Bern falls 20 places and Copenhagen 13.
Gas: Stockholm is the outlier
Residential natural gas prices including taxes range from 1.5 c€/kWh in Kyiv to 34.8 c€/kWh in Stockholm, a clear outlier. Amsterdam is a distant second at 21.2 c€/kWh, while the EU average across capitals is 11.9 c€/kWh. Among the five largest economies, Paris is the most expensive for gas at 15.7 c€/kWh, while Madrid (10.1) and London (10.3) are the cheapest. Rome (15.2) and Berlin (12.5) are above the EU average.
In PPS terms, Stockholm remains the most expensive for gas at 28.5, while Budapest is the cheapest at just 3.6. Lisbon (18.6), Amsterdam (18.1), Rome (15.9) and Sofia (15.6) complete the top five. Among the five largest economies, London (8.3) is the cheapest after adjustment, while Rome (15.9) is the most expensive. Paris (14.4) is above the EU average, whereas Madrid (11.3) and Berlin (11.2) are below it.
Adjusting for purchasing power makes gas look more expensive in some capitals. Sofia shows the biggest shift, rising from 18th in euro terms to fifth in PPS terms, while Riga moves up six places. By contrast, Dublin and Brussels record the largest downward shifts, each falling 10 places, followed by Bern (nine) and London (seven).
Cheap on one bill, costly on the other?
Some capitals show stark contrasts between electricity and gas costs. Stockholm and Amsterdam have low or mid-range electricity prices but the most expensive gas. Bucharest, Brussels and London show the opposite pattern: high electricity prices but relatively cheap gas.
How prices have changed since before the Iran war
Between February and September 2026, some cities saw significant changes. For electricity, Lisbon recorded the largest rise at 22%, followed by Amsterdam (17.3%), Madrid (15.1%) and Rome (14.9%). Luxembourg City saw the largest decline at 15.3%, followed by Tallinn (7.9%) and Helsinki (7.1%).
For gas, Tallinn recorded by far the largest rise, with prices increasing by 59.2% from 7.8 to 12.4 c€/kWh. Prices also rose by more than 20% in Brussels (37.9%), Athens (33.1%), Bern (30.2%), London (28.2%), Riga (23%), Vienna (22.8%), Paris (22.5%) and Berlin (22%).
These September figures may not yet reflect the full impact of the latest surge in wholesale gas prices. With storage levels low and geopolitical tensions persisting, European governments are already responding. Greece has boosted its heating allowance by 30%, while France has tapped strategic diesel reserves to ease pump prices. The coming months will test how effectively such measures shield households from the volatility of global energy markets.